How to Add a Chart in Google Slides
At the time of writing this post Google Slides do not allows to insert a chart from the Insert menu, however you can add your own charts by creating the chart in Google Sheets first and then using copy & paste to copy the chart into your Google Slides presentation.
Here are some tips on how to add a new data-driven chart into Google Slides by creating it first in Google Sheets.
Create a new Sheets documents and insert the data for the chart.
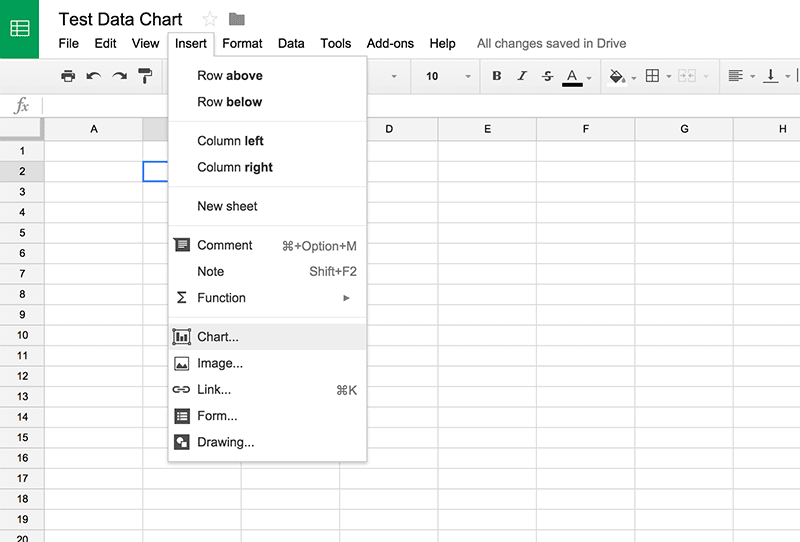
Open Insert -> Chart to display the charts dialog box and here choose the chart type that you’d like to generate.
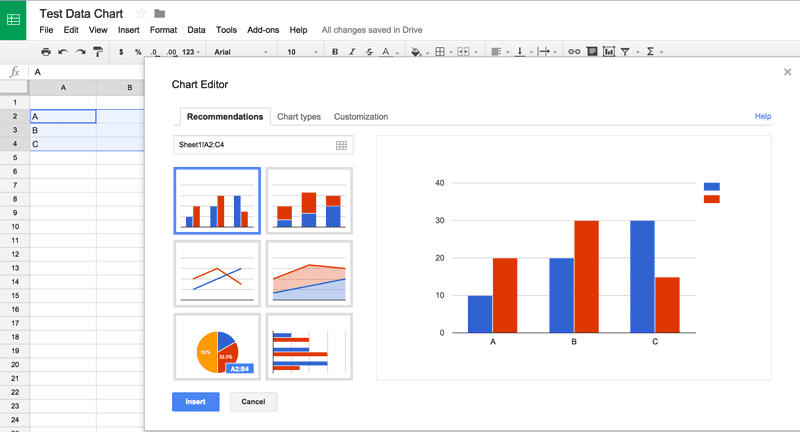
There are multiple chart types available. The recommendations tab will show you recommended charts but there is also another Chart types tab that you can choose to display the full list of available charts.
Once ready, click Insert to insert the new chart into the Google Sheets document.
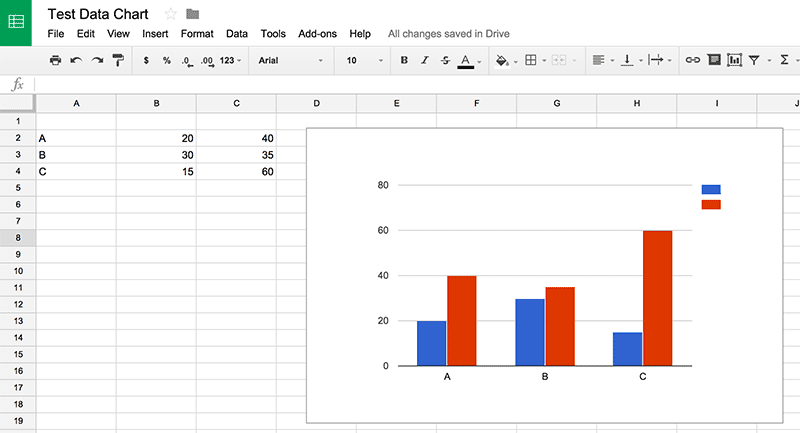
Now, select the chart and click Edit -> Copy to copy the chart into the clipboard.
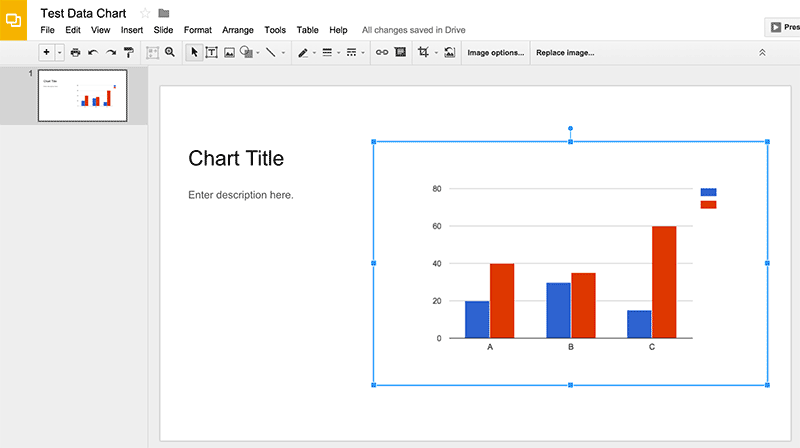
Then, open the Google Slides presentation and locate the slide where you’d like to insert the chart. Once the slide is selected, click Edit -> Paste to paste the chart into the slide.
Below is an example of a bar chart with two series inserted into a Google Slides presentation.
The same process works for other kind of charts, for instance if you’d need to insert a Pie Chart into Google Slides, Line Charts, Area Charts or even Geo Charts with maps.